Offspring of parents with desired phenotype are mated to seed next generation
After >1 generations, the population phenotype will be vastly different
The genotype of organisms with the desired phenotype will be vastly different than ancestor genotype
Artificial selection
Code
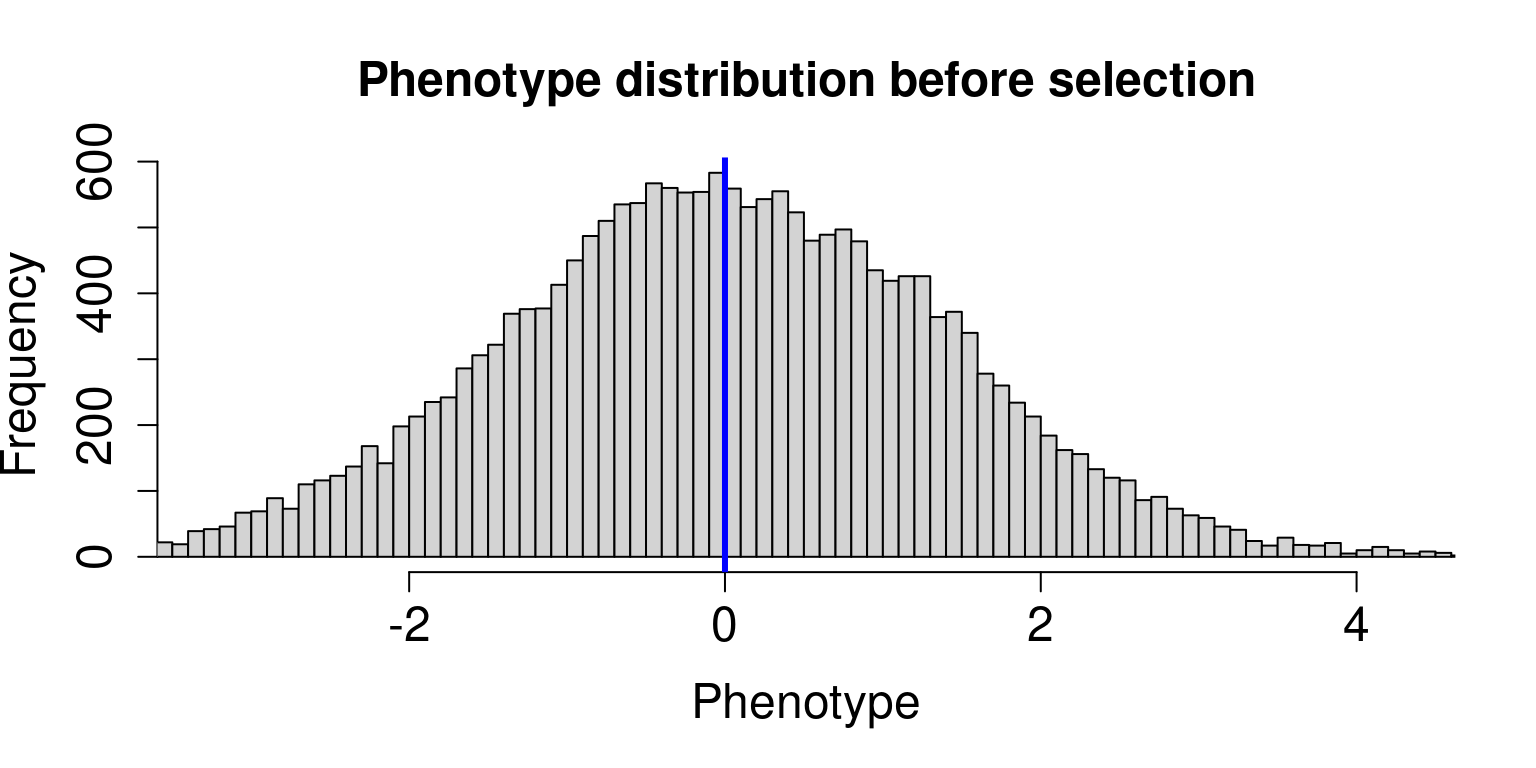
allele.freq<-0.5L <-1000environ.var<-1sel<-0.1Num_inds=10000##MAKE A MUM## For each mother, at each locus we draw an allele (either 0 or 1) from the population allele frequency. ##We do this twice for each mother two represent the two haplotypes in the mother mum.hap.1<-replicate(Num_inds, rbinom(L,1,allele.freq) )mum.hap.2<-replicate(Num_inds, rbinom(L,1,allele.freq) )##type mum.hap.1[,1] to see the 1st mothers 1st haplotype##Each mothers genotype at each locus is either 0,1,2mum.geno<-mum.hap.1+mum.hap.2additive.genetic<-colSums(mum.geno)mean.genetic<-mean(additive.genetic)genetic.var<-sd(additive.genetic)additive.genetic<-additive.genetic /sd(additive.genetic)mum.pheno<- additive.genetic +rnorm(Num_inds,sd=sqrt(environ.var))mum.pheno<-mum.pheno-mean(mum.pheno)###FAMILIES##MAKE A DAD (same code as make a mum, only said in a deeper voice)dad.hap.1<-replicate(Num_inds, rbinom(L,1,allele.freq) )dad.hap.2<-replicate(Num_inds, rbinom(L,1,allele.freq) )dad.geno<-dad.hap.1+dad.hap.2additive.genetic<-colSums(dad.geno)additive.genetic<-additive.genetic /sd(additive.genetic)dad.pheno<- additive.genetic +rnorm(Num_inds,sd=sqrt(environ.var))dad.pheno<-dad.pheno-mean(dad.pheno)### Make a childchild.geno<-dad.hap.1+mum.hap.1##1/2 from mum 1/2 from dadadditive.genetic<-colSums(child.geno)additive.genetic<-additive.genetic /sd(additive.genetic)child.pheno<- additive.genetic +rnorm(Num_inds,sd=sqrt(environ.var))child.pheno<-child.pheno-mean(child.pheno)##Selection of top sel% of individualstop.sel.per.mums<- mum.pheno>quantile(mum.pheno,p=1-sel) top.sel.per.dads<- dad.pheno>quantile(dad.pheno,p=1-sel)child.geno<-dad.hap.1[,top.sel.per.dads]+mum.hap.1[,top.sel.per.mums] ##1/2 from mum 1/2 from dadadditive.genetic<-(colSums(child.geno)-mean.genetic)additive.genetic<-additive.genetic/genetic.varchild.pheno<- additive.genetic +rnorm(length(child.geno),sd=sqrt(environ.var))my.lim<-quantile(c(mum.pheno,dad.pheno),p=c(0.01,0.99))my.lim[2]<-quantile(child.pheno,p=c(0.99))hist(c(mum.pheno,dad.pheno),breaks=100,xlim=my.lim,xlab="Phenotype",main=paste("Phenotype distribution before selection"),cex.axis=1.5,cex.lab=1.5,cex.main=1.5); abline(v=0,col="blue",lwd=3)
Code
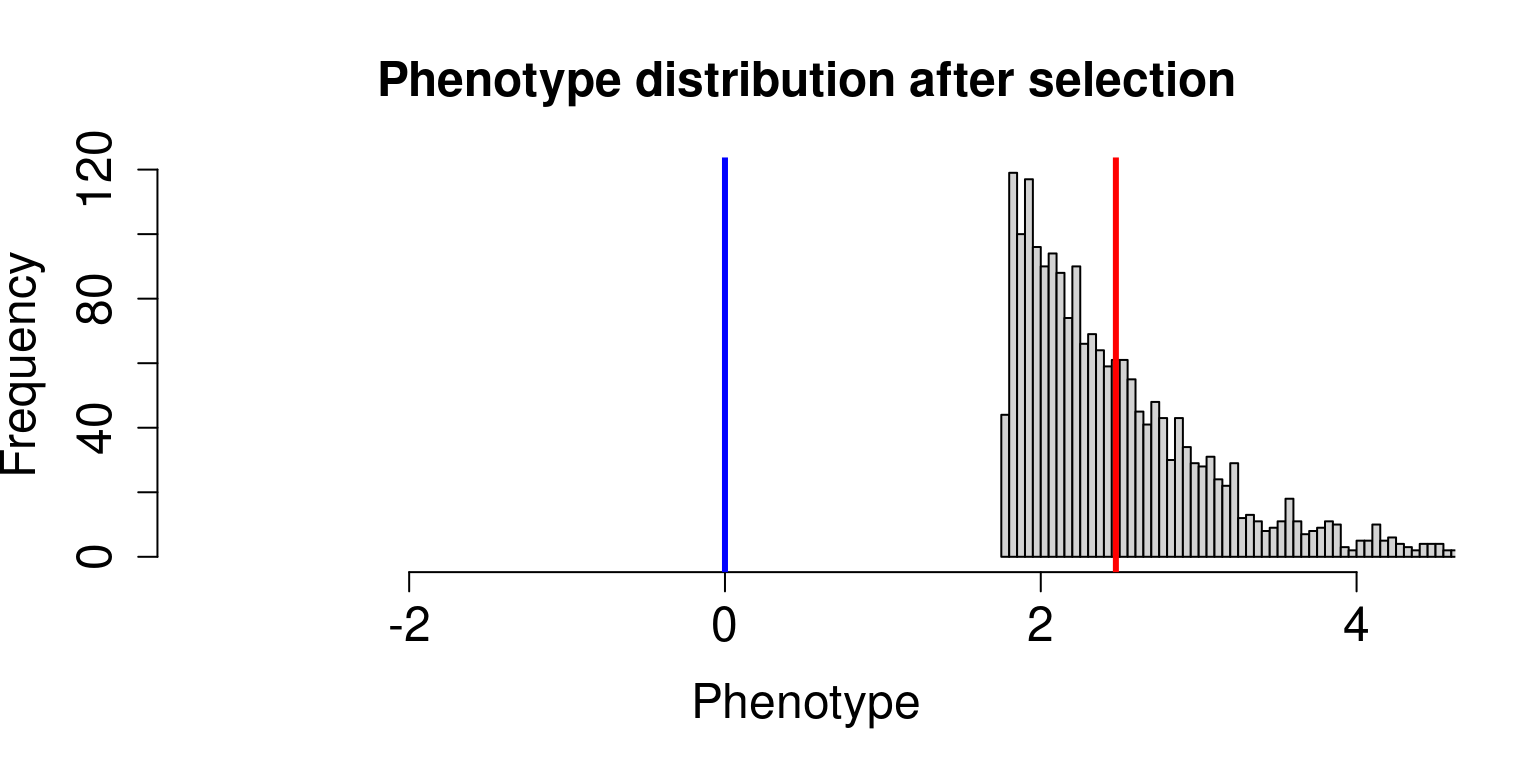
par.mean<-mean(c(mum.pheno[top.sel.per.mums],dad.pheno[top.sel.per.dads]))hist(c(mum.pheno[top.sel.per.mums],dad.pheno[top.sel.per.dads]),breaks=100,xlim=my.lim,xlab="Phenotype",main="Phenotype distribution after selection",cex.axis=1.5,cex.lab=1.5,cex.main=1.5); abline(v= par.mean,col="red",lwd=3)abline(v=0,col="blue",lwd=3)
Code
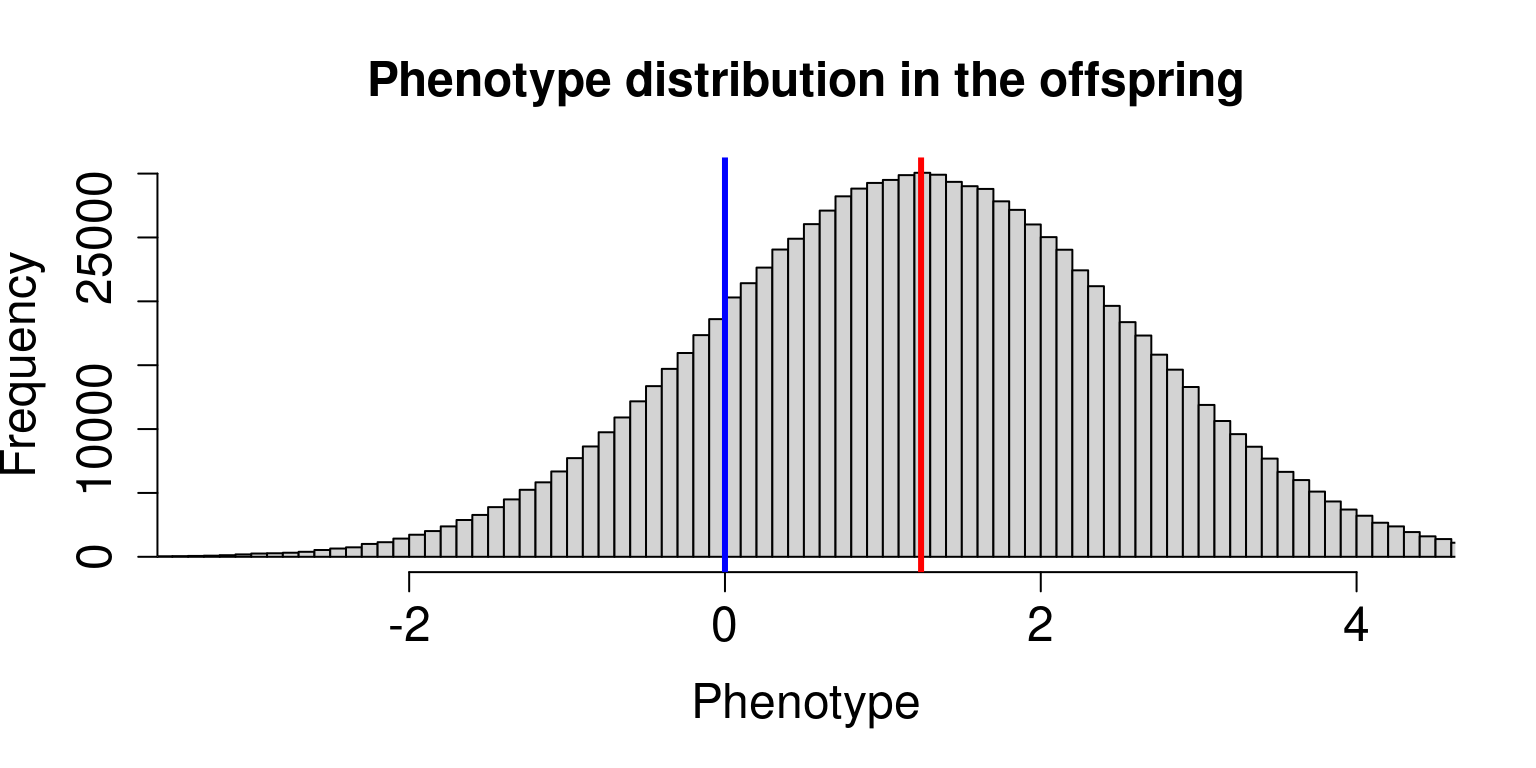
hist(child.pheno,xlim=my.lim,breaks=100,xlab="Phenotype",main="Phenotype distribution in the offspring",cex.axis=1.5,cex.lab=1.5,cex.main=1.5); abline(v=0,col="blue",lwd=3)abline(v=mean(child.pheno),col="red",lwd=3)
Evolve and resequence
Sequence ancestor DNA
Artificially select for n generations
Resequence organisms from the nth generation
Compare genetic differences between ancestor and nth generation