The evolution and genetic basis of complex traits in D. melanogaster

Z. Forrest Elkins

University of Missouri - Columbia

January 9, 2023

Complex traits

  • Not a single gene with two alleles
  • Poly- or omni-genic
    • many genes of small effect
  • Continuous phenotypic data

A quantitative, complex trait – polar bear weight

Genetic basis

Sample genome-wide association study (GWAS) with simulated data

Experimental evolution

  • Artificially select for some phenotype
    • Offspring of parents with desired phenotype are mated to seed next generation
  • After >1 generations, the population phenotype will be vastly different
  • The genotype of organisms with the desired phenotype will be vastly different than ancestor genotype

Artificial selection

Evolve and resequence

  • Sequence ancestor DNA
  • Artificially select for n generations
  • Resequence organisms from the nth generation
  • Compare genetic differences between ancestor and nth generation

Bulk segregant analysis

  • Artificially select for opposing phenotypes (denoted as ‘high’ and ‘low’) in as low as 1 generation
  • Sequence ‘high’ bulks and ‘low’ bulks
    • Bulk = pooled genetic sample
  • Compare genetic differences between bulks

Overview

Genetic basis of exploration tendency in a multiparent population of D. melanogaster


Phenotypic differences in starvation resistance between selection lines of an experimentally evolved population of D. melanogaster

Exploration tendency

Dispersal and exploration

  • Dispersal – complex trait
    • Any movement with potential to lead to gene flow
  • Exploration – complex trait
    • Sub-phenotype of dispersal
    • Moving from known environment to unknown environment

Drosophila exploration

  • D. melanogaster can get all the resources they need from a piece of vegetable rot
  • What causes a fly to leave its current environment for a novel environment?
    • Costly investment
    • Trade-off with other traits like reproduction & lipid storage

Main questions

Is exploration a heritable trait?
I.e., how large a genetic component contributes to variation in exploration within the population?
If so, what on the genetic level contributes to exploration in Drosophila?
What are the differences in genetic architecture between exploring and non-exploring flies?

Heritability background

Heritability
The degree of variation in a phenotypic trait in a population due to genetic variation in the population
Broad-sense heritability
Total genetic variability over total phenotypic variability
Cannot calculate narrow-sense heritability in the DSPR due to lack of family data

Drosophila Synthetic Population Resource

Heritability experimental setup

Heritability results

\[\begin{gather*} H^2 = V_G / V_P = 0.4 \end{gather*}\]

Main questions

Is exploration a heritable trait?
I.e., how large a genetic component contributes to variation in exploration within the population?
If so, what on the genetic level contributes to exploration in Drosophila?
What are the differences in genetic architecture between exploring and non-exploring flies?

Bulk-segregant analysis population

Bulk-segregant analysis population

G’ statistic

  • Stochasticity in sequence coverage
  • Variation in allele frequency estimates due to organism sampling during the formation of the bulks
  • Null hypothesis: no QTL, i.e., allele is equally expected in both bulks

Results

Randomization significance testing

  • Markov chain Monte Carlo (MCMC) method
    • Resampling algorithm

G’ statistic

Simulated G’ value comparison for null (no QTL) and significant (QTL present)

Allele frequencies of explorers (E) and non-explorers (NE) at significant G’ QTL locations

Allele frequencies of explorers (E) and non-explorers (NE) at significant G’ QTL locations

Chromosome Position Gene Associated phenotype
2L 17054316, 17054384 CG15136 Abnormal flight
18515161 Ugt201D1 Enables UDP-glycosyltransferase activity
CG10211 Involved in response to oxidative stress
3L 6818526 vvl Specification of cell fates, patterning and immune defense
12226612 app Regulation of fat signaling, abnormal locomotive behavior
14401683, 14401693, 14401703 Dscam2 Abnormal neuroanatomy, size, body color
3R 25454633 Men Abnormal heat stress response, abnormal sleep
27194130 G14369, CG14370 Little to no information
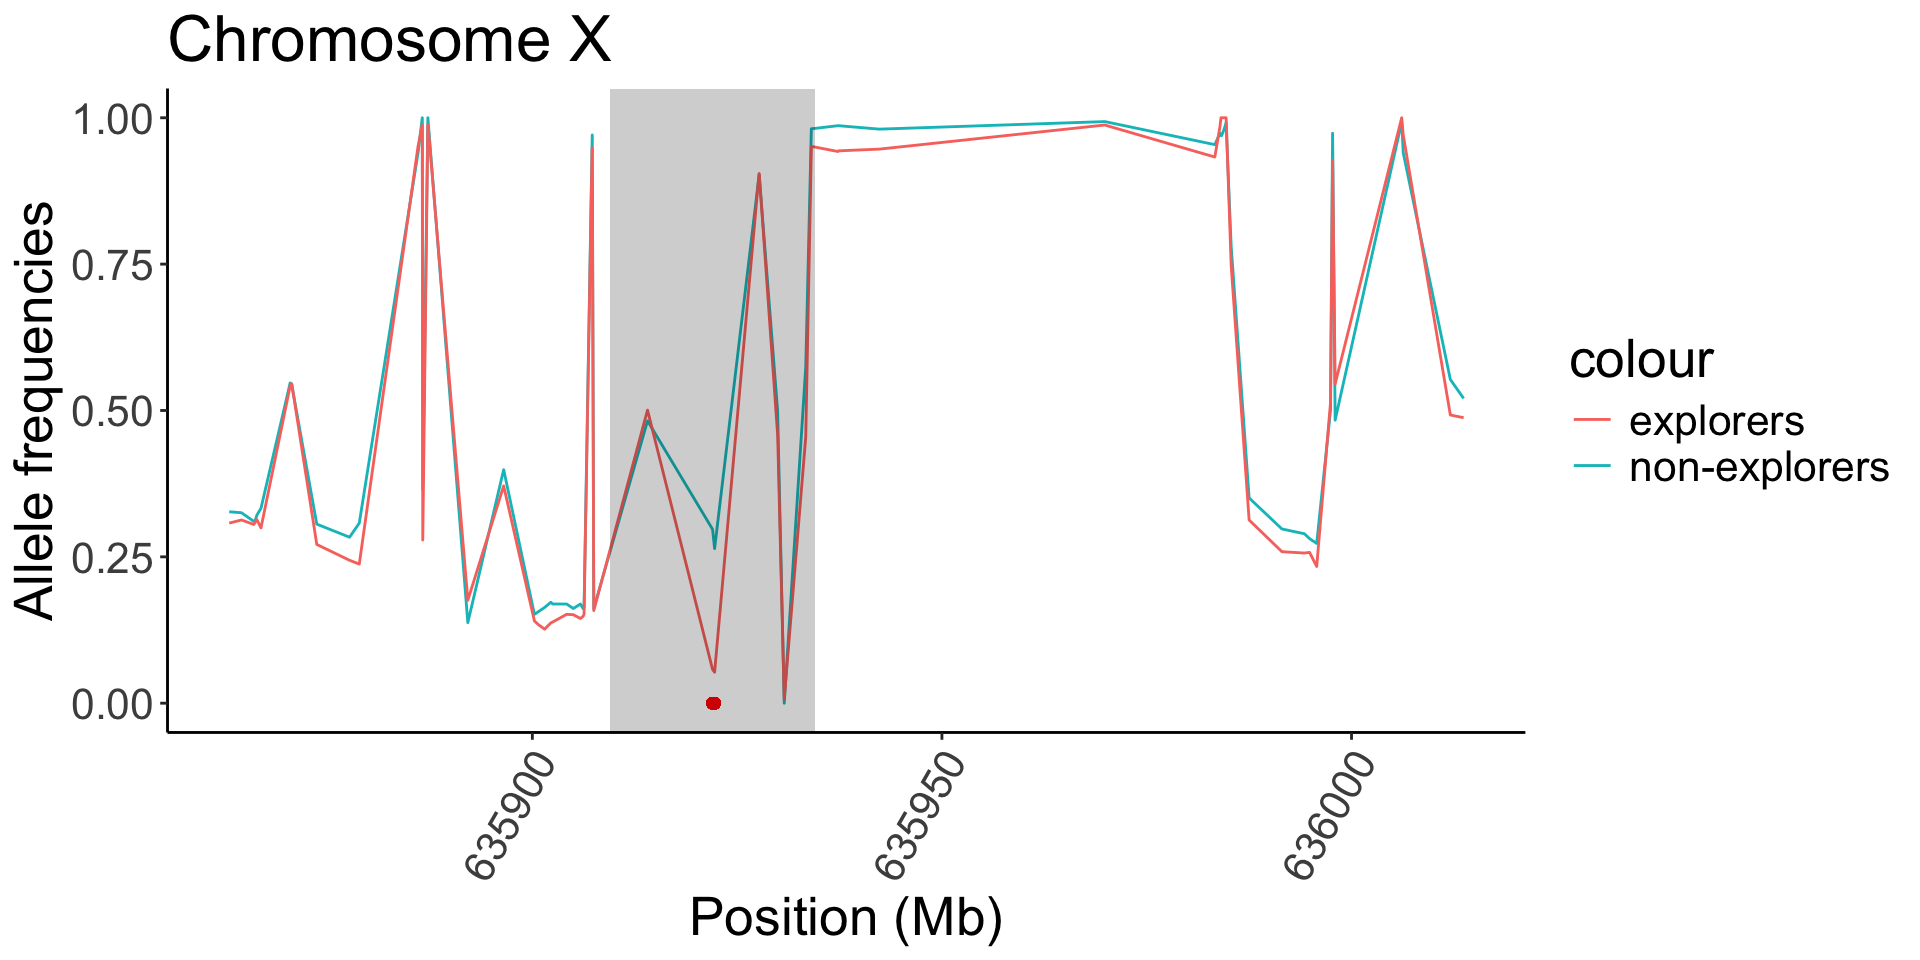
X 10174752, 10174756 CG32767 Expressed in wing hinge primordium and wing pouch
12446014 Btnd Flightless, abnormal heat stress response
Efr Manifests in wing vein
sqh Involved in cytokinesis and tissue morphogenesis
dtn Abnormal heat stress response

Conclusions

  • Exploration behavior is a heritable trait
  • Implicated QTL involved in stress & flight traits
  • Established a novel method of allele frequency estimation in a bulk-segregant experimental paradigm

Overview

Genetic basis of exploration tendency in a multiparent population of D. melanogaster


Phenotypic differences in starvation resistance between selection lines of an experimentally evolved population of D. melanogaster

Starvation resistance

Starvation resistance

  • Adaptation that confers resistance to environmental stressor
    • ‘Hunker down’ tactic

Starvation resistance

  • Correlated with higher lipid storage
    • More body lipid, higher starvation resistance1,2
  • Evolved quicker in female D. simulans than males2
    • 5 generations vs. 15 generations
  • Alters feeding behavior in D. melanogaster3

Experimental evolution population

Selection experiment

Three selection lines:

  1. Fluctuating availability (FA)
  2. Deteriorating availability (DA)
  3. Constant high availability (CHA)

Three diets:

  1. Control (C)
  2. Dietary restrictive (DR)
  3. High sugar (HS)
Selection Days post-oviposition
8 - 13 14 - 17 18 - 21
FA C DR C
DA C C DR
CH HS HS HS
Eclosure: Day 10
Egg collection: Day 21

Main questions

Does starvation resistance co-evolve with resource allocation strategies in D. melanogaster?
I.e., are certain selection lines more resistant to starvation than others?
Is starvation resistance phenotypically plastic?
I.e., can the same genotype give rise to various phenotypes depending on the environment?

Direct measurement assay

Survival analysis

  • Survival data
    • Time-to-event
    • Clear start and end time
  • Time-to-death
    • Start: placed onto nutritionless agar
    • End: time of death

Censoring survival data

  • ‘Censoring’ occurs if a subject doesn’t experience the event by the end of the experiment
  • Flies that die due to other factors
    • Ex.: crushed by vial plug
  • Still provide valuable information
    • Survival analysis appropriately accounts for this

Survivor analysis and censoring

\[Y_i = min(T_i,C_i)\]

  • \(Y_i\): observed time
  • \(T_i\): event time
  • \(C_i\): censoring time

Kaplan-Meier survival curves

The Kaplan-Meier estimate is the product of the survival probabilities:

\[\prod_{i=0}^n S(t) \] Where we estimate survival probability as the number of flies alive at the current time, divided by the number of flies alive at the previous time.

Cox proportional hazard model

Characteristic HR1 95% CI2 p-value
Selection
CH
DA 1.73 1.30, 2.31 <0.0001
FA 1.41 1.05, 1.88 .022
Sex
F
M 1.90 1.50, 2.42 <0.001
1 HR = Hazard Ratio; 2 CI = Confidence Interval

AICc model comparison

Top performing Cox proportional hazard model:

\[Selection + Sex + Batch,\] \[\Delta AIC = 0.00\]

Second-best Cox proportional hazard model:

\[Selection + Sex,\]

\[\Delta AIC = 2.31\]

Main questions

Does starvation resistance co-evolve with resource allocation strategies in D. melanogaster?
I.e., are certain selection lines more resistant to starvation than others?
Is starvation resistance phenotypically plastic?
I.e., can the same genotype give rise to various phenotypes depending on the environment?

Diet treatment assay

The risk (1 - survival probability) of death between males and females

The cumulative hazard (-log (survival probability)) over time for flies from our three diet treatments.

Survival probability in female flies predicted by diet and selection line

Cox proportional hazard model

Characteristic HR1 95% CI2 p-value
Diet
C
DR 0.72 0.54, 0.96 0.027
HS 0.49 0.37, 0.67 <0.001
Selection
CH
DA 1.16 0.87, 1.54 0.3
FA 1.27 0.94, 1.70 0.12
Sex
F
M 3.34 2.52, 4.43 <0.001
1 HR = Hazard Ratio; 2 CI = Confidence Interval

AICc model comparison

Top performing Cox proportional hazard model:

\[Diet + Selection + Sex,\]

\[\Delta AIC = 0.00\]

Second-best Cox proportional hazard model:

\[Diet*Selection + Sex,\]

\[\Delta AIC = 2.96\]

Conclusions

  • CHA & FA selection lines confer higher SR resistance
    • ‘Thrifty’ spending vs. abundance of riches
  • Both CHA selection line and HS diet groups resisted starvation for a significantly longer period of time
    • Flies from CH selection line on DR diet treatment had worse SR
  • In direct measurement flies, we saw significant differences in SR for the selection groups in both KM and Cox
  • In diet treatment flies, selection by itself was not a significant predictor, while diet was
    • Diet + Selection, and Diet * Selection, however, were significant in our Cox model

Summary

  • Adaptations to environmental stress
    • ‘Leaving’
    • ‘Hunkering down’
  • Identified candidate genes underlying exploration tendency
    • Some genes involved with other environmental stress traits
  • Observed the co-evolution of starvation resistance alongside resource allocation strategies
    • Resource allocation strategies confer various levels of SR
    • An organism’s environmental upbringing impacts SR
    • Eating sugar is good for you!

Acknowledgements

The King Lab, past and present
  Dr. Libby King

My committee
  Dr. Lauren Sullivan
  Dr. Rex Cocroft
  Dr. Greg Blomquist

My friends & family
  Dr. Arianne Messerman
  Mom, Dad, Liv, Sam & Haley
  Jo Moaton

Funding
  Life Sciences Fellowship
  NIH

DNA Core

Special thank you to Debbie Allen, Rebecca Ballew, Nila Emmerich, Melody Kroll, the IT office and the RSS group.

Extra slides

Different approaches

DROP THIS SLIDE, put in extra slides – put ‘main questions’ slide here again - QTL mapping - Requires family information - Maps linkage genes - Identification of QTL underlying a phenotype via analysis of polygenic inheritance - Genome-wide association study - Requires phenotyping of hundreds of RILs - Whole-genome sequencing data - Associates small changes in polygenic SNP frequencies with phenotype - Bulk-segregant analysis - Allows for rapid testing of extreme phenotypes - Need genetic variation for extreme selection to act on

Survival probability

The probability that a fly will survive past a given time, i.e., survival probability:

\[S(t) = Pr(T > t) = 1 - F(t),\] \[F(t) = Pr(T \le t)\]

Statistical error in BSA-seq

estAF <- function(cvg,trueAF){
  est <- rbinom(1,cvg,trueAF) / cvg
  return(est)
}
  • Function calculating estimated allele frequency
  • Takes in coverage and ‘true’ allele frequency
  • Outputs estimated allele frequency

# run this n times, scale up 
n <- 1000
tru <- 0.43
cvg <- sample(2:150,n,replace = TRUE)
af <- tibble(
  "cvg" = cvg,
  "trueAF" = rep(tru,times=n)
)

Variability in allele frequency estimations due to coverage.

Significance thresholds

  • False discovery rate (FDR)
    • Expected proportion of false “discoveries,” i.e., Type I error
  • Family-wise error rate (FWER)
    • Probability of making >= 1 false “discoveries”
    • Stricter than FDR
Null hypothesis is… TRUE FALSE
Rejected Type I error Correct
Accepted Correct Type II error